The Ultimate Guide to NAV Calculation for Investment Funds
Net Asset Value sits at the center of every investment fund. It determines what investors own, what managers earn, and what regulators scrutinize. Yet for many fund managers, especially those running Alternative Investment Funds (AIFs) or Actively Managed Certificates (AMCs), NAV calculation remains a fragile, manual process held together by spreadsheets and institutional memory.
This guide covers the full landscape of NAV calculation: the formulas, the fee mechanics, the compliance requirements, and the technology that ties it all together. Each section links to a dedicated deep-dive article so you can explore the topics that matter most to your fund.
What Is NAV and Why Does It Matter?
Net Asset Value is the total value of a fund’s assets minus its liabilities, expressed either as an aggregate figure or on a per-share basis. It is the single number that tells every stakeholder, investors, regulators, auditors, and the manager, what the fund is worth at a given point in time. Without an accurate NAV, subscriptions are mispriced, redemptions are unfair, and performance fees are wrong.
NAV matters because it is the price at which investors enter and exit the fund. When an LP subscribes at a given NAV per share, they are trusting that the figure reflects the true economic value of the portfolio. When they redeem, they expect the same precision. Any error, even a small one, compounds across every transaction that follows.
Beyond pricing, NAV serves as the foundation for performance measurement, fee calculations, and regulatory reporting. A fund that cannot produce a reliable NAV cannot attract institutional capital, pass an audit, or satisfy its compliance obligations.
For a complete introduction to the concept and its role across fund structures, read our article on What Is Net Asset Value (NAV) and Why Does It Matter?.
The NAV Formula: How to Calculate Net Asset Value
At its core, NAV equals total assets minus total liabilities. The per-share figure divides that result by the number of outstanding shares or units. While the formula looks simple on paper, the difficulty lies in correctly valuing every asset and capturing every liability, accrued fees, pending expenses, and unrealized gains or losses included.
The distinction between Gross NAV and Net NAV is critical. Gross NAV reflects the portfolio’s market value before any fees or expenses are deducted. Net NAV, the figure investors actually see, subtracts management fees, performance fees, fund expenses, and any other accrued liabilities. The gap between these two numbers is where the fund’s cost structure lives.
Consider a straightforward example. A fund holds CHF 50 million in listed equities and CHF 2 million in cash. Accrued management fees stand at CHF 125,000, accrued performance fees at CHF 400,000, and other liabilities (audit, legal, admin) total CHF 75,000.
- Gross NAV: CHF 52,000,000
- Total Liabilities: CHF 600,000
- Net NAV: CHF 51,400,000
- NAV per share (assuming 500,000 shares outstanding): CHF 102.80
Every line item in that calculation must be defensible. The asset valuations need market data or an approved methodology. The fee accruals need to follow the fund’s offering documents to the letter. Our detailed walkthrough in How to Calculate NAV covers each component step by step, including the treatment of multi-currency portfolios and illiquid positions.
How Often Should You Calculate NAV?
The right frequency depends on your fund structure, investor expectations, and regulatory requirements. Most AIFs calculate NAV monthly or quarterly; AMCs often require daily or weekly valuations because they trade on secondary markets. Hedge funds with liquid strategies typically run daily or weekly NAVs, while private equity vehicles may only strike a NAV quarterly.
Frequency is not just an operational decision, it is a governance decision. More frequent NAV strikes catch pricing errors early, reduce the window for stale valuations, and give investors timely information. But each calculation cycle carries a cost: data sourcing, reconciliation, review, and sign-off all consume time and resources.
The tension between accuracy and operational burden is real. A fund calculating daily NAVs on illiquid assets will spend more time on valuation judgments than one running monthly on a listed equity book. The key is matching frequency to the liquidity profile of the portfolio and the expectations set in your fund documents.
We explore the trade-offs, and the regulatory minimums for FINMA, ESMA, and SEC-regulated structures, in NAV Calculation Frequency.
Fee Mechanics: The Engine Inside the NAV
Fees are the most complex and error-prone component of NAV calculation. A fund’s management fee, performance fee, hurdle rate, high-water mark, crystallization schedule, and equalization logic all interact to determine the liabilities that reduce Gross NAV to Net NAV. Getting any one of these wrong doesn’t just affect the manager’s revenue, it changes the price at which every investor transacts.
Crystallization
Performance fees move from an accrued liability to an earned, payable amount at crystallization. The timing, annual, quarterly, or upon redemption, is defined in the fund documents and must be applied consistently. Crystallizing too early or too late distorts the NAV for the periods on either side of the event.
A common example: a fund with annual crystallization accrues a performance fee throughout the year based on unrealized gains. If the portfolio drops in December, the accrual reverses and no fee is crystallized. But if an investor redeemed in November based on an interim NAV that included a large accrual, they may have been undercharged. This is why crystallization-on-redemption provisions exist, and why the logic must be airtight. Read the full mechanics in Performance Fee Crystallization.
High-Water Marks
The high-water mark (HWM) ensures managers only earn performance fees on new profits, not on recovering old losses. Tracking HWMs per investor, especially across multiple series with different inception dates, is where spreadsheets start to break. Each investor’s HWM resets only when their individual peak NAV is surpassed and a fee is crystallized.
For a fund with 200 investors across 15 series, the operational burden depends on the method used. In a true series structure, the HWM is usually tracked at series level; under investor-level equalization, additional investor-specific reference records may also be needed. Either way, one incorrect reset can cascade through every subsequent NAV. We break down the calculation in High-Water Mark Calculation.
Fee Basis, Periods, and Accruals
Before you can calculate any fee, you need to know three things: what is the fee charged on (the basis), over what time window (the period), and how is it recognized between calculation dates (the accrual method). Management fees might be charged on Net NAV, Gross NAV, or committed capital. Performance fees might accrue daily but crystallize annually.
The interaction between these parameters creates dozens of permutations, each requiring its own logic path. The Building Blocks of Fund Fee Calculation maps these permutations clearly.
Hurdle Rates
A hurdle rate sets a minimum return threshold before performance fees kick in. Hurdles can be hard (fees only on returns above the hurdle), soft (fees on the entire return once the hurdle is cleared), or based on a floating benchmark like SOFR + 200bps. The choice fundamentally changes the fee economics and must be reflected precisely in every NAV calculation. See Hurdle Rates in Performance Fees for worked examples.
Equalization
In open-ended performance-fee structures, when investors subscribe at different times and different NAV levels, a fairness problem arises. An investor who enters after a drawdown could ride the recovery up to the previous high-water mark without paying any performance fee, the so-called “free ride.” Equalization mechanisms (equalization credits, equalization deposits, or multi-series accounting) exist to ensure that every investor pays fees only on their own gains.
Equalization is arguably the single hardest problem in fund accounting. It requires tracking investor-level adjustments that persist across multiple NAV periods and interact with crystallization and HWM logic. We explain the methods and their trade-offs in Equalization and the Free Ride Problem. For a closer look at why handling HWM and equalization manually is a compliance risk in its own right, see Why Manual Fee Calculation Is a Compliance Minefield.
NAV by Fund Type
Every fund structure imposes its own rules on how NAV is calculated, what gets valued, and who oversees the process. A UCITS fund, an offshore hedge fund, and a Swiss AMC may all hold similar assets but produce their NAV under very different operational and regulatory frameworks. Understanding these differences is essential for managers operating across structures.
AIFs (Alternative Investment Funds)
AIFs under AIFMD face specific requirements for valuation policies, independent oversight, and reporting to national competent authorities. The NAV process must follow a documented valuation policy that covers both liquid and illiquid positions, with clear procedures for fair value adjustments. Managers who delegate to a fund administrator still retain ultimate responsibility for the accuracy of the NAV.
The regulatory expectations, from Annex IV reporting to depositary oversight, create a compliance layer that sits on top of every NAV cycle. Our dedicated guide on NAV Calculation for AIFs walks through these requirements in detail.
AMCs (Actively Managed Certificates)
AMCs are structured products, not funds, but they still require precise NAV calculation to determine the certificate’s value on the secondary market. The key difference is speed: AMCs often trade on exchanges or OTC platforms and need daily, sometimes intraday, valuations. The issuing bank and the manager must agree on the valuation methodology, and any discrepancy between the manager’s shadow NAV and the issuer’s official NAV creates operational friction.
We cover the unique challenges of AMC valuation, including the role of the issuer and the treatment of structural fees, in NAV Calculation for AMCs. For managers looking to grow their AMC book without proportionally expanding headcount, Scaling Your AMC Without Scaling Your Back Office outlines the operational model.
Reg-S Offshore Funds
Funds distributed under the Regulation S safe harbor (17 CFR §§ 230.901–230.905) are organized outside the United States, typically in the Cayman Islands, BVI, or Luxembourg, and sold exclusively to non-US persons. They carry lighter US regulatory overhead than registered domestic vehicles, but the NAV process is far from simple. A one-year distribution compliance period for Category 3 equity interests requires ongoing investor eligibility tracking at the ledger level, alongside the multi-currency share class accounting and investor-level High-Water Mark management common to offshore hedge and private equity structures. Beyond US rules, Cayman funds must also satisfy CIMA registration requirements, FATCA reporting under 26 U.S.C. §§ 1471–1474, and the OECD Common Reporting Standard.
Our dedicated guide covers these requirements in full: NAV Calculation for Regulation S Offshore Funds.
VCCs (Singapore Variable Capital Companies)
The Variable Capital Company is Singapore’s corporate fund vehicle, increasingly used as an Asian alternative or complement to a Luxembourg AIF. An umbrella VCC strikes a separate NAV for each ring-fenced sub-fund, and the constitution requires shares to be issued and redeemed at the proportionate NAV per share. Tax-incentivised VCCs must appoint a Singapore-based fund administrator, while MAS expects asset valuation to be independent of portfolio management. Our guide to NAV Calculation for Singapore VCCs covers the per-sub-fund mechanics, and VCC vs Luxembourg AIF: NAV Requirements Compared sets the two regimes side by side.
Hedge Funds
Hedge funds bring complexity through leverage, short positions, derivatives, and multi-prime relationships. The NAV must account for margin balances, swap mark-to-market, financing costs, and the netting of long/short exposures. Side pockets for illiquid positions add another layer: gating investors from redeeming their pro-rata share of an asset that cannot be sold at the stated NAV.
NAV Calculation for Hedge Funds covers these mechanics, including the reconciliation challenges that arise from working with multiple prime brokers.
Private Equity and Illiquid Assets
When assets don’t have a market price, the NAV becomes an opinion rather than a fact. Private equity and venture capital funds rely on fair value methodologies, discounted cash flows, comparable transactions, revenue multiples, that require judgment and documentation. The International Private Equity and Venture Capital Valuation (IPEV) Guidelines provide a framework, but implementation is where the complexity lives.
Quarterly NAV strikes in PE also mean that stale valuations can persist for months, creating a disconnect between the reported NAV and the fund’s true economic value. NAV Calculation for Private Equity and Illiquid Assets explores these valuation challenges and the governance structures that surround them.
The NAV Process: From Data to Published Report
Producing a NAV is a multi-step workflow that begins with data collection and ends with a signed-off, published report. Each step, position reconciliation, price sourcing, accrual calculation, review, and approval, introduces potential for delay or error. A well-designed process turns this into a repeatable, auditable pipeline; a poorly designed one turns it into a monthly fire drill.
The end-to-end process typically follows this sequence:
- Data ingestion, pulling positions, cash balances, and corporate actions from custodians and brokers.
- Price sourcing, matching every holding to a market price or approved fair value.
- Accrual computation, calculating management fees, performance fees, fund expenses, and any income accruals.
- NAV strike, assembling the balance sheet: Gross NAV, deducting liabilities, arriving at Net NAV per share.
- Review and sign-off, a four-eyes check (or more) before the number goes out.
- Distribution, publishing the NAV to investors, administrators, exchanges, and regulators.
We map this workflow in detail, with common failure points and best practices, in The NAV Calculation Process.
Two components of the process deserve special attention. The unitholder register tracks every subscription, redemption, transfer, and distribution for every investor. It is the source of truth for share counts, HWM levels, and equalization adjustments. Errors in the register propagate directly into the NAV. Managing the Unitholder Register explains how to maintain it with precision.
For funds with multiple share classes or series, each with its own fee structure, currency, or HWM, the process multiplies in complexity. A single portfolio can produce ten or more distinct NAVs per calculation date, each requiring its own fee waterfall and reconciliation. Multi-Series Fund Administration covers the operational patterns that make this manageable.
Compliance, Audit, and Risk
An accurate NAV is table stakes; a provably accurate NAV is what passes audits and satisfies regulators. Every assumption, every data source, every override must be documented and traceable. Managers who treat the NAV as a number rather than a process inevitably face painful audit cycles and, in the worst case, restatements that erode investor confidence.
Audit Readiness
The annual audit should not be a scramble. If your NAV process produces a clean audit trail, timestamped calculations, source data references, documented overrides, and approval logs, the audit becomes a verification exercise rather than a reconstruction exercise. We have seen funds cut their audit preparation time by 60% simply by moving from spreadsheet-based workflows to a system-of-record approach.
The keys to an audit-ready NAV are consistency (same process every period), completeness (every line item documented), and accessibility (auditors can self-serve the data they need). The Audit-Ready NAV provides a practical checklist.
NAV Errors and Restatements
Errors happen. The question is whether you catch them before or after the NAV is published. Common sources include stale prices, missed corporate actions, incorrect fee accruals, and data-entry mistakes in the unitholder register. Most fund documents define a materiality threshold, typically 0.5% to 1% of NAV, above which a restatement is required.
A restatement is expensive in every dimension: financial (compensating affected investors), operational (recalculating every downstream figure), and reputational (explaining to your investors why their statements were wrong). Prevention through automated controls and reconciliation checks is always cheaper than remediation. NAV Errors and Restatements examines root causes and how to build error-prevention into your process.
Swing Pricing and Anti-Dilution
When large subscriptions or redemptions hit a fund, the existing investors bear the transaction costs of deploying or liquidating capital. Swing pricing and anti-dilution levies adjust the NAV to protect continuing investors by passing those costs to the transacting party. Implementing swing pricing correctly requires real-time awareness of fund flows and a clear governance framework for setting swing factors. Swing Pricing and Anti-Dilution Levies explains the mechanics and regulatory expectations.
Reporting and Investor Relations
The NAV report is the primary communication channel between a fund and its investors. A well-structured report does more than convey a number, it builds trust by showing investors exactly how that number was derived, what fees were charged, and how their individual position has changed.
Institutional LPs increasingly treat the quality of NAV reporting as a proxy for operational maturity. A fund that delivers a clear, detailed report on schedule signals that its back office is under control. A fund that delivers a single-page PDF with just a NAV per share invites questions, and due diligence scrutiny.
At a minimum, a professional NAV report should include: a portfolio summary, a balance sheet (Gross NAV to Net NAV bridge), a fee breakdown, a performance summary, and investor-level statements. For funds with multiple series or complex fee structures, additional detail on equalization adjustments and HWM levels is expected by sophisticated investors.
Understanding what each section communicates, and what investors are really looking for, is covered in How to Read a NAV Report. For insight into how transparent NAV reporting serves as a competitive edge during fundraising, see Transparency as a Fundraising Tool. For managers navigating the regulatory side, NAV Reporting Requirements maps the obligations across jurisdictions, including AIFMD Annex IV, FINMA reporting, and SEC Form PF.
Technology and Automation
Manual NAV processes do not scale. A fund with five investors and one share class can survive on spreadsheets. A fund with 200 investors, six series, daily frequency, and a performance fee with HWM and equalization cannot. At some point, the operational risk of the manual process exceeds the cost of automation, and for most funds, that point comes earlier than managers expect. For a detailed examination of what that operational risk looks like in practice, see The Hidden Cost of Spreadsheets.
Automation addresses three categories of risk simultaneously. Accuracy risk drops because fee calculations follow deterministic logic rather than manually maintained formulas. Operational risk drops because the process is repeatable and not dependent on a single person’s knowledge of a spreadsheet. Compliance risk drops because every calculation produces an audit trail by default.
The shift from spreadsheets to dedicated NAV software also changes the role of the back office. Instead of spending days on data entry, reconciliation, and formula debugging, the team focuses on exception management: reviewing flagged items, approving overrides, and analyzing edge cases. This is where human judgment adds value, not in copying numbers between tabs.
We explore the practical steps for transitioning to automated NAV production in Automating NAV Calculation, covering what to automate first, how to run parallel processes during migration, and what to look for in a platform. For a broader perspective on architecture and infrastructure choices, cloud vs. on-premise, API integrations, and data pipelines, see Modern NAV Infrastructure.
Where to Start
If you are running a fund today and producing NAVs manually, the path forward is not an overnight transformation. It is a sequence of deliberate steps: documenting your current process, identifying the highest-risk manual touchpoints, and replacing them systematically with automated, auditable workflows.
The articles linked throughout this guide are designed to help you do exactly that. Whether you need to understand equalization for the first time or evaluate whether your current process would survive an audit, we have written each piece to be practical, specific, and immediately useful.
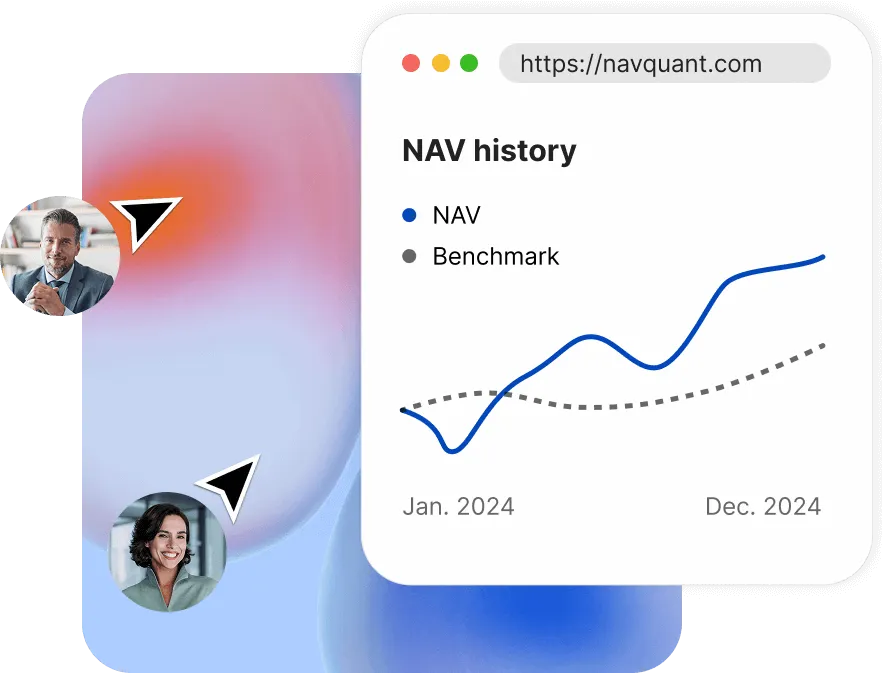
Ready to modernize your NAV process? NAVquant is the cloud-based platform built by investment managers, for investment managers, automating NAV and fee calculations with transparency, precision, and audit-ready reporting.