How to Read a NAV Report: A Practical Guide for Limited Partners and Investors
A Net Asset Value (NAV) report is one of the most important documents you receive as a Limited Partner or investor in an Alternative Investment Fund (AIF) or Actively Managed Certificate (AMC). Yet many investors skim it, focusing only on the bottom-line number. That habit can cost you.
This guide walks through each section of a standard NAV report, explains what the numbers actually mean, and highlights the red flags that should trigger further questions. For a deeper understanding of the underlying concept, see our Ultimate Guide to NAV Calculation.
NAV Report Field Reference
| Report Field | What It Means | Red Flag If… |
|---|---|---|
| Total NAV | Fund’s net assets after all liabilities | Inconsistent with prior period without explanation |
| NAV per share | Per-unit value for subscription/redemption pricing | Moves unexpectedly vs. market conditions |
| Reporting date | Valuation snapshot date | Significantly before delivery date (stale) |
| Fee breakdown | Management fee, performance fee, expenses | Lumped into single line; unverifiable |
| HWM / series detail | Investor-specific peak NAV and fee reference | Missing entirely; cannot verify fee calculation |
| Valuation methodology | How illiquid/complex assets are priced | Not disclosed for non-exchange-traded holdings |
| Audit trail references | Systems, vendors, data sources cited | No provenance; report cannot be independently verified |
This guide focuses on interpreting NAV reports as a reader and investor. For the regulatory minimums and filing obligations that govern what must be reported, see NAV Reporting Requirements.
What Does the Summary Section Tell You?
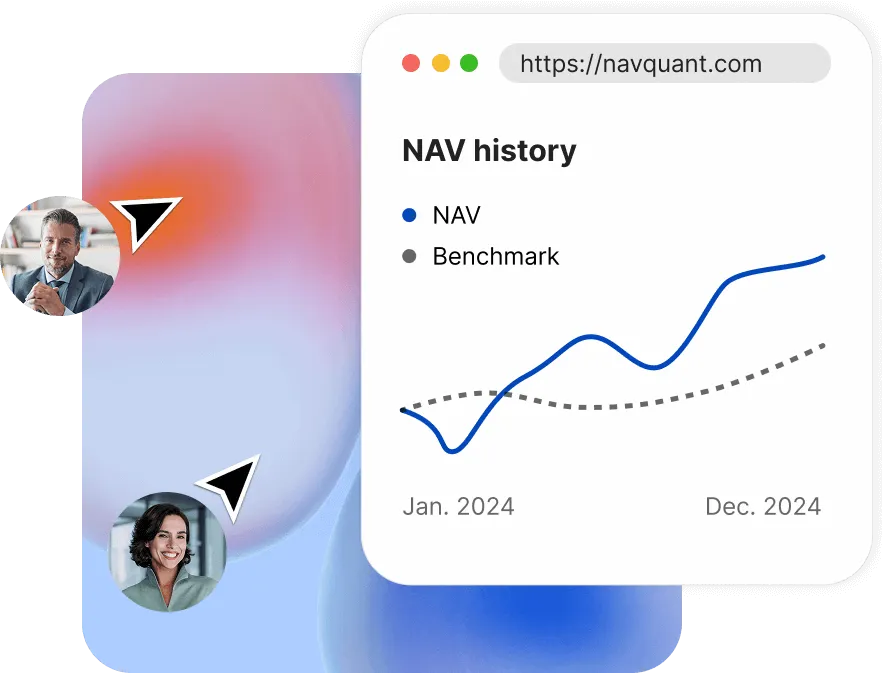
The summary section gives you the fund’s headline figures at a glance: total NAV, NAV per share or unit, the reporting date, and, in well-structured reports, a benchmark comparison. These four data points tell you what the fund is worth, when it was valued, and how it performed relative to its target.
Total NAV represents the net value of all fund assets minus all liabilities. NAV per share divides that total by the number of outstanding units, giving you a standardized measure that accounts for subscriptions and redemptions over time. Always check the reporting date, a NAV dated two weeks before delivery may reflect stale pricing. If a benchmark is included, compare the fund’s return over the period to that benchmark. Significant divergence without explanation warrants a conversation with the manager.
Understanding what NAV is and how it’s calculated is essential before diving into the details that follow.
What Does the Asset Breakdown Reveal?
The asset section shows you the composition of the portfolio: individual holdings, cash balances, receivables, and any other assets. A transparent report gives you enough granularity to understand concentration risk and liquidity without requiring you to reverse-engineer the strategy.
Portfolio holdings should list positions with their market values and, ideally, the valuation methodology used for each. Look for the split between liquid and illiquid assets, this ratio matters for redemption risk. The cash position tells you how much dry powder the manager holds and how defensively the fund is positioned. Receivables include items like pending trade settlements or dividend income that has been accrued but not yet received. If receivables are consistently large relative to NAV, ask why settlement is delayed.
What Should You Look for in the Liability Section?
The liability section discloses everything the fund owes: accrued management and performance fees, expenses payable to service providers, and any pending redemptions. This section reduces gross asset value to the net figure investors actually own.
Accrued fees represent charges that have been calculated but not yet deducted from the fund. They typically include the management fee accrued since the last payment date and any crystallized or estimated performance fee. Expenses payable cover audit costs, legal fees, administrator charges, and custody fees. Redemptions payable are particularly important during periods of market stress, a large figure here can signal liquidity pressure. If liabilities are growing faster than assets, this is a trend worth investigating.
How Are Fees Presented in a NAV Report?
The fee section breaks down exactly how much you are paying, and for what. A professional NAV report separates management fees, performance fees, and other fund expenses so you can evaluate each independently.
Management fees are typically calculated as a fixed percentage of NAV, charged annually but accrued monthly or quarterly. Verify that the rate matches your fund’s offering documents. Performance fees are more complex: they are usually calculated above a hurdle rate and subject to a High-Water Mark (HWM), meaning the manager only earns incentive compensation on new profits above the previous peak. Check whether your report discloses the current HWM and the hurdle applied. Other expenses, admin, custody, audit, legal, should be itemized. If they appear only as a lump sum labeled “other,” you are not getting the transparency you deserve.
What Investor-Specific Information Should Be Included?
Beyond fund-level figures, your NAV report should include a section personalized to your investment: the number of units you hold, the NAV attributable to your position, your individual HWM, and, if applicable, your investor series.
Series accounting exists because investors who subscribe at different times have different cost bases and HWMs. Your NAV per unit may differ from another investor’s, even in the same fund. If your report does not clearly show your series and its specific HWM, you have no way to independently verify your performance fee calculation. This is one of the most common sources of disputes between managers and LPs, and one of the easiest to prevent with proper reporting infrastructure.
How Does Performance Attribution Explain Returns?
A complete NAV report explains not just what the fund returned, but why. Performance attribution breaks down returns by asset class, sector, geography, or individual position, depending on the fund’s strategy and reporting sophistication.
This section helps you distinguish between skill and market beta. If 90% of a fund’s quarterly return came from a single position, that is useful context for evaluating risk going forward. Attribution also reveals the drag of fees and expenses on gross returns. The best reports show gross-to-net performance bridges, making the cost of investing in the fund explicit rather than buried in the numbers.
What Red Flags Should Investors Watch For?
Not all NAV reports are created equal. Knowing what to look for, and what’s missing, is as important as understanding the numbers themselves. A few warning signs should prompt immediate follow-up with your fund manager or administrator.
Watch for these issues:
- Missing fee breakdowns: If management and performance fees are lumped into a single line, you cannot verify the calculation.
- Inconsistent NAV per share movements: If NAV per share jumps or drops in ways that don’t align with market movements, there may be a valuation methodology change or an error.
- No valuation methodology disclosure: For funds holding illiquid or hard-to-value assets, the absence of methodology notes is a material omission.
- No audit trail references: Professional reports cite the data sources, pricing vendors, and systems used. A report with no provenance is a report you cannot independently verify.
- Stale asset prices: Check that pricing dates match the NAV reporting date. Stale prices, especially in less liquid markets, can significantly misrepresent fund value.
For more on how transparent reporting builds investor trust, see Transparency as a Fundraising Tool. And for a full picture of what regulators expect in a NAV statement, read our guide to NAV Reporting Requirements.
Struggling to make sense of your fund’s NAV reports? NAVquant generates professional, investor-ready NAV reports, automated, transparent, and always audit-ready.